Maverick qPCR System (MQ4 Series) Instruction Manual (V1.0) - Chapter 4
Prev Article:Chapter 3 Instrument Installation
Chapter 4 Software Operation Guide
Anitoa qPCR software can be used to set up experiments, run experiments, and collect, analyze and manage experimental data. The software contains three main functional modules, namely "Test", "Data " and "Setup".
1) "Test" module: It mainly includes creating new experiments, setting experimental parameters, importing experimental templates and running experiments.
2) "Data" module: mainly contains experimental data analysis, upload, import data, export data, export PDF, standard curve.
3) "Setup" module: mainly contains upload configuration, user management, user switching, WLAN, Bluetooth, language, virtual keyboard, date and time, display, application information, version update, software version check, instrument number.
4.1 Launch software
1) After the instrument is turned on, it automatically enters the main interface of the software - Test.
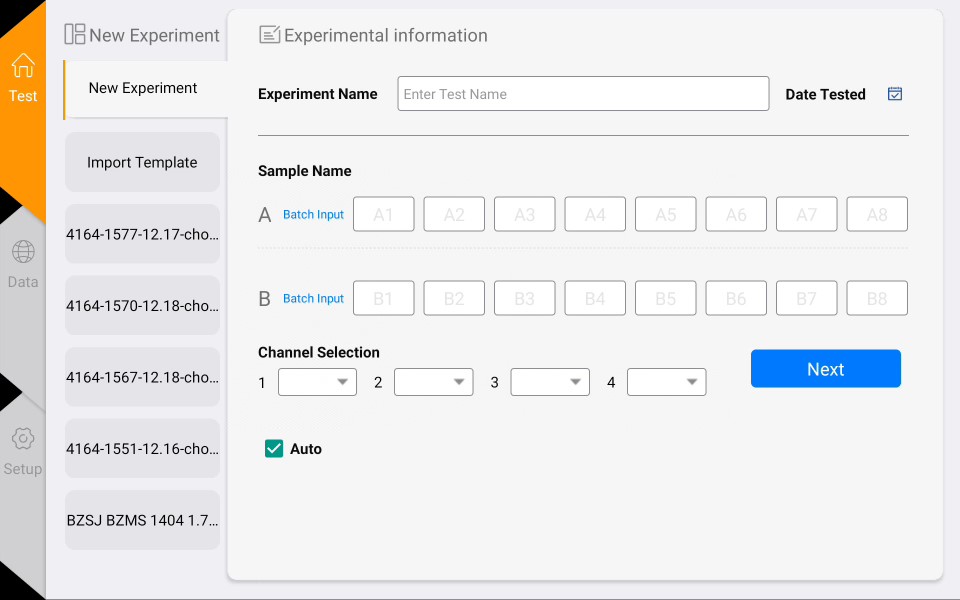
Figure 4-1-1 Main interface of the software
4.2 Experimental settings
1) In the Test interface, click <New Experiment>(Figure 4-2-1) the right panel is the Experiment Setting 1, in the Experiment Setting 1 (Figure 4-2-2), enter the experiment name, select the corresponding channel, select the well position, and enter the sample information, etc., and click "Next" to enter the Experiment Setting 2.
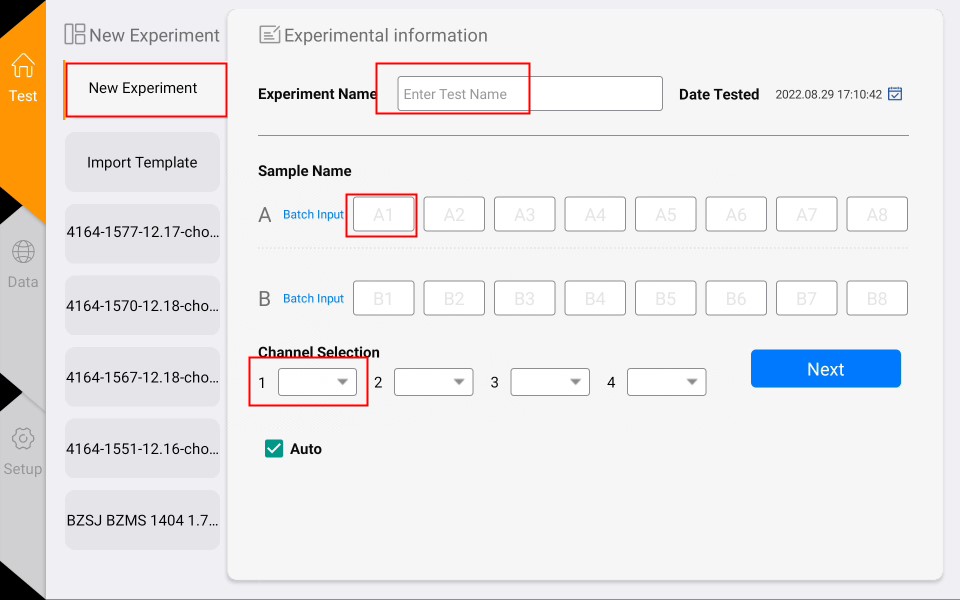
Figure 4-2-1 New experiment interface
2) In Experiment Setting 2 (Figure 4-2-3), set the reaction program (parameters such as reaction temperature, reaction time, number of cycles, photo stage, etc.).
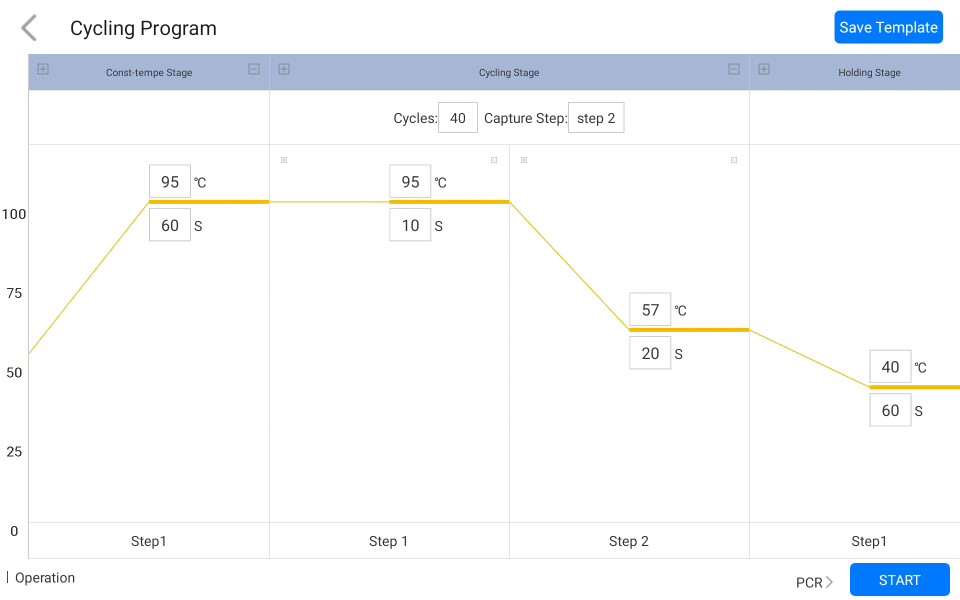
Figure 4-2-2 Experimental Setting 2
4.3 Save Template
1) Click the "Save Template" icon in the upper right corner to save the current template.
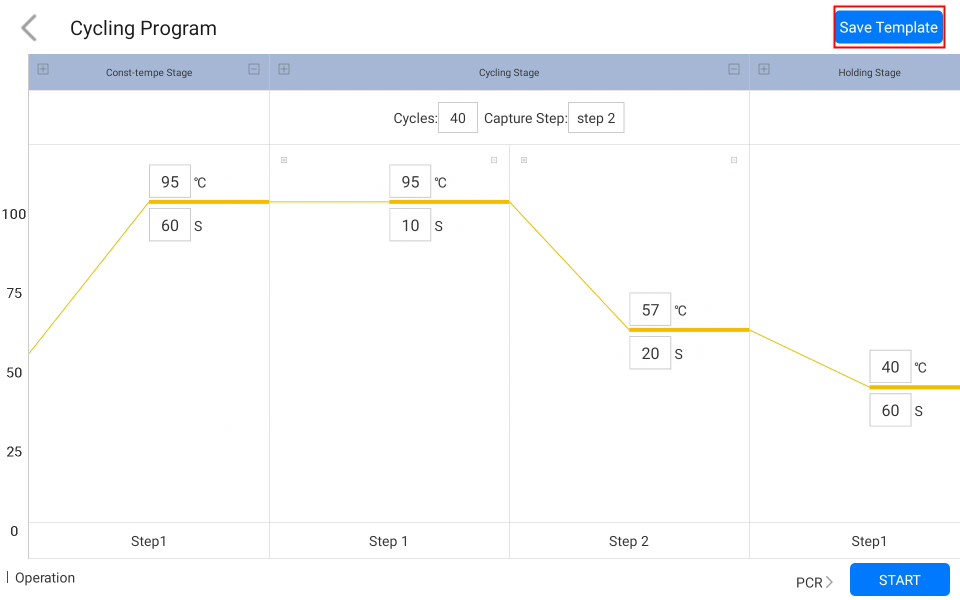
Figure 4-3-1 Program setting interface
2) The saved templates will appear in the "Test" interface for selection. Click the second option "Import Template" to import other experiment templates.
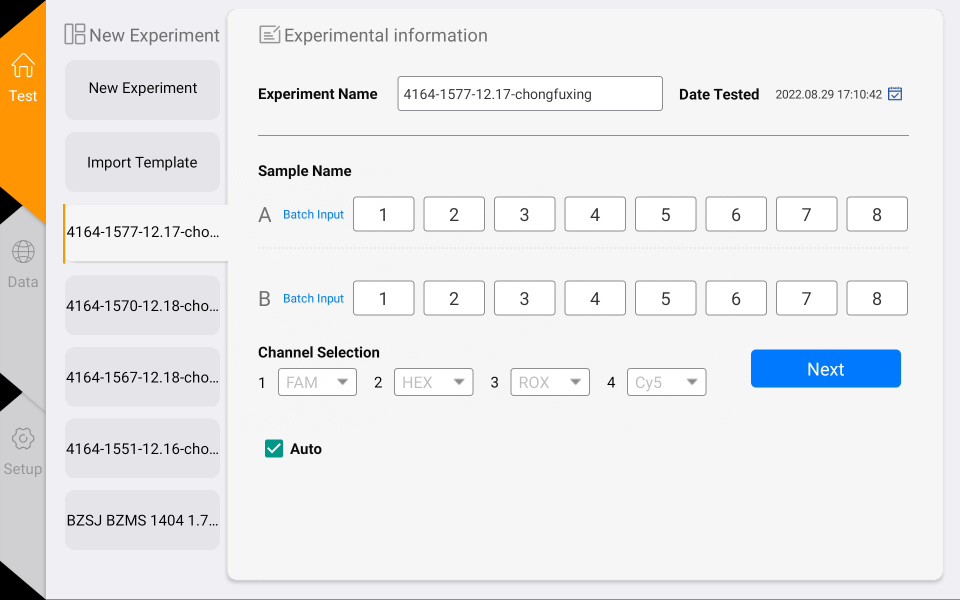
Figure 4-3-2 View the template page
4.4 Run the experiment
After the experiment settings are completed, click the "Start" button to start the experiment and enter the "Running" interface. Click "Force to stop" at the top right corner to stop the experiment.
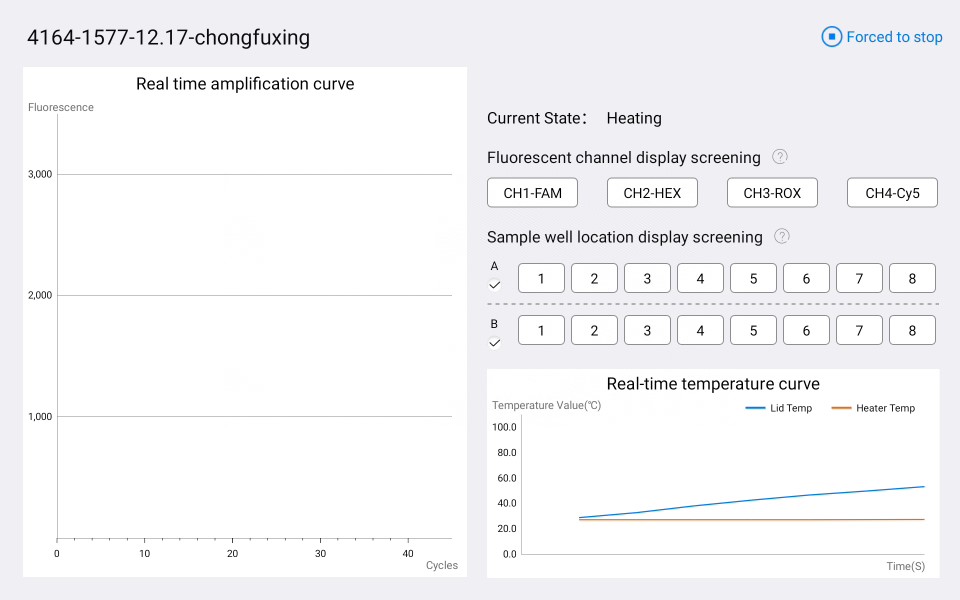
Figure 4-4-1 Running interface
In the experiment running interface click the channel buttons and sample well buttons on the right side to filter the image information, and the sample wells have an all-select button to filter the whole row.
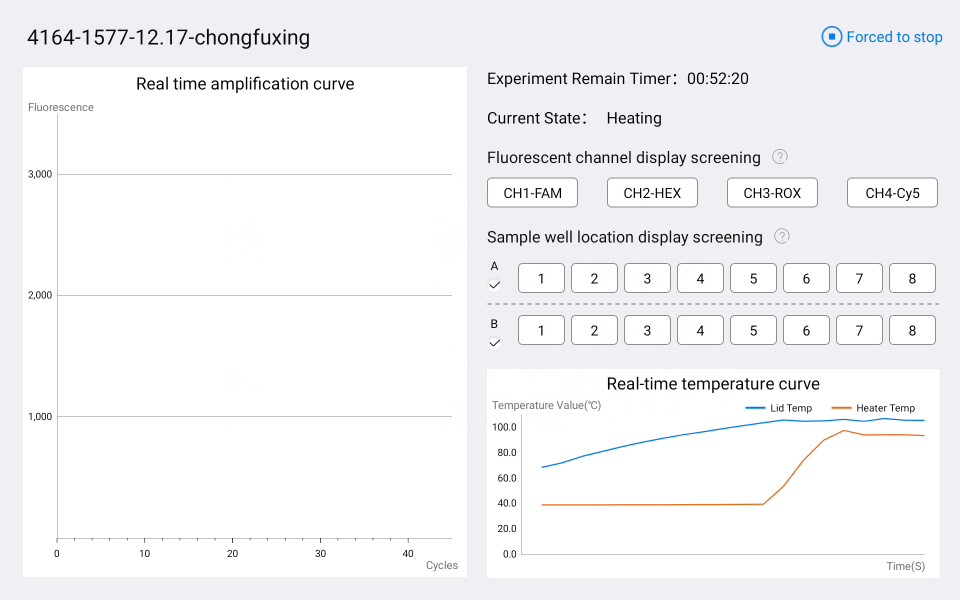
Figure 4-4-2 Running interface
4.5 Experimental analysis
1) Click the "Date" button on the main page to enter the "Result Analysis" page, as shown in Figure 4-5-1.
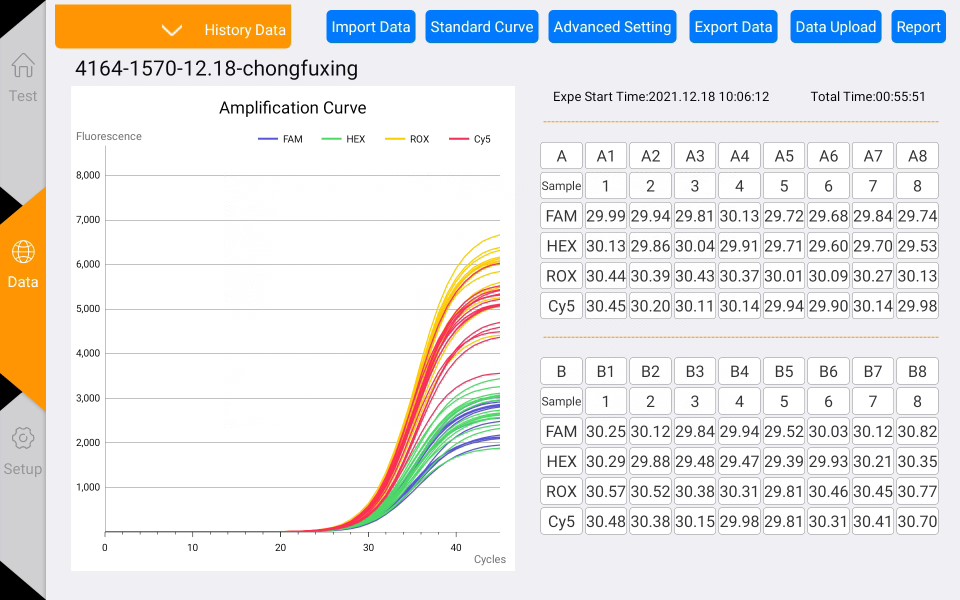
Figure 4-5-1 Result analysis interface
2) Click the History Data button above, you can pop up the historical experimental data results, select any one of the experimental results, you can view the data, such as Figure 4-5-2.
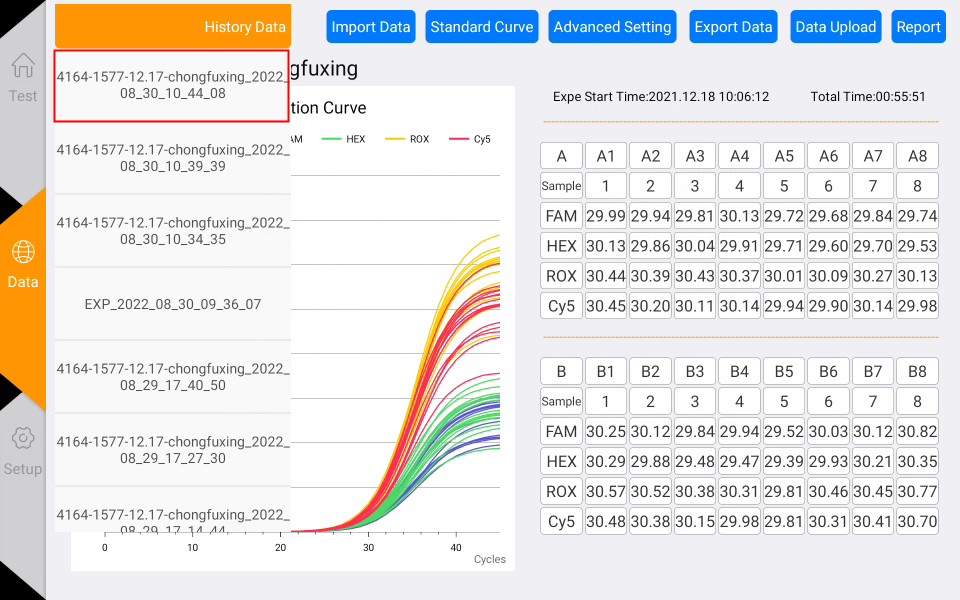
Figure 4-5-2 Date list
3) Experimental analysis (click the Advanced Setting button)
a. Adjust the baseline Ct lower limit.
b. Adjust Ct threshold percentage: default is 10%.
c. Normalize: normalize the amplification curve without affecting the results.
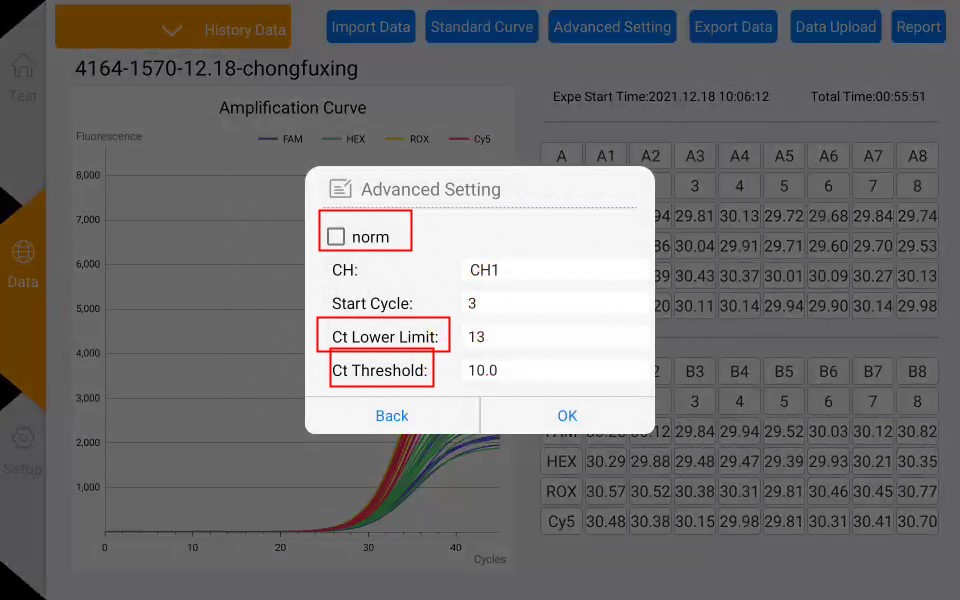
Figure 4-5-3 Experimental analysis- Advanced setting interface
d. Click on the channel and well buttons in the data table on the right to select the wells and channels for data analysis. (Gray button means not selected)
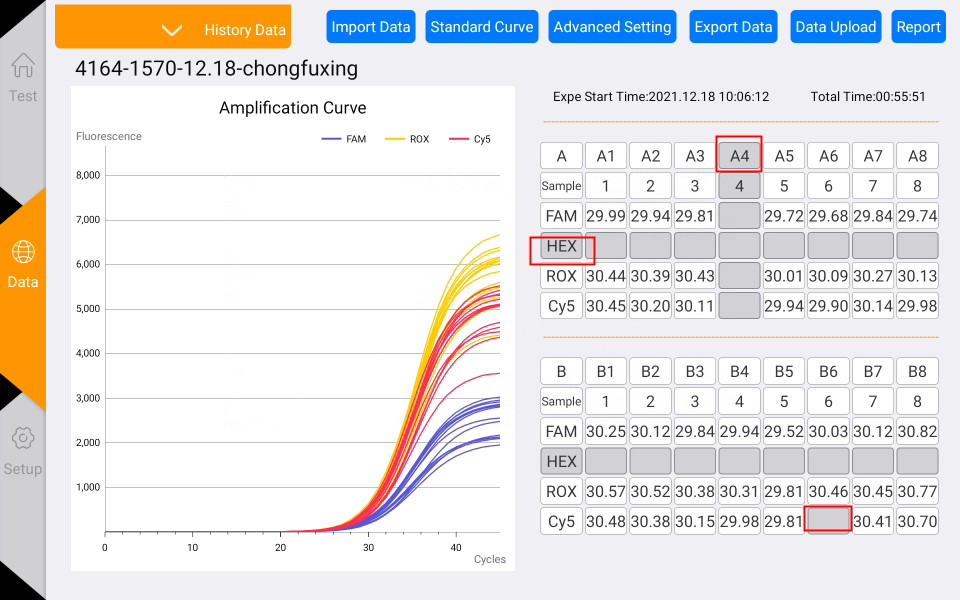
Figure 4-4-5 Data filtering interface
4) Calculate the standard curve
a. Click the Standard Curve button in the data interface to enter the standard curve interface (as shown in Figure 4-5-4).
b. Manually input the standard concentration, calculate the standard curve, and save it.
c. Then select Unknown Points, click Find Unknown, and select Use Saved Standard Curve to calculate the concentration of the unknown sample based on the Ct value.
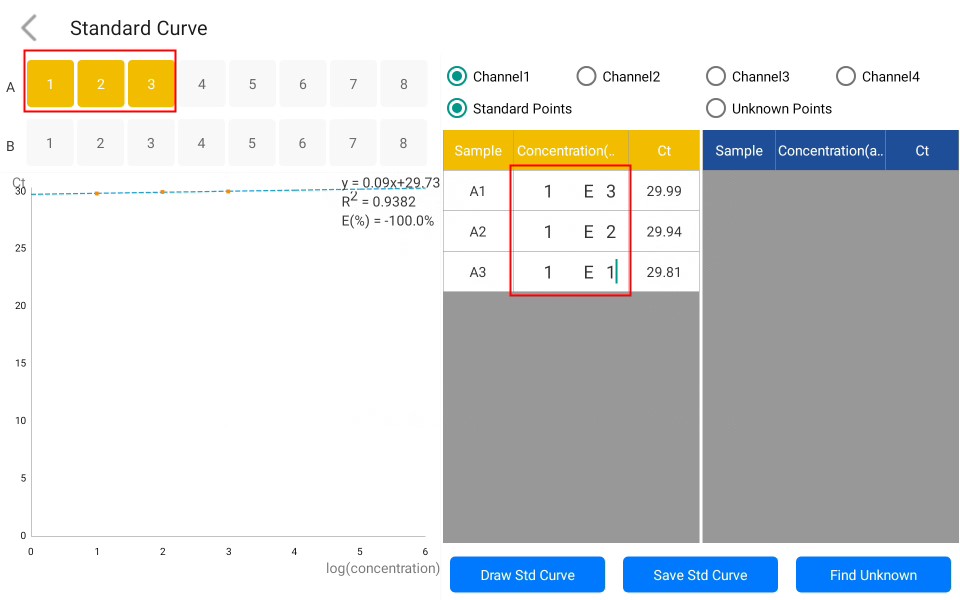
Figure 4-5-4 Standard curve interface
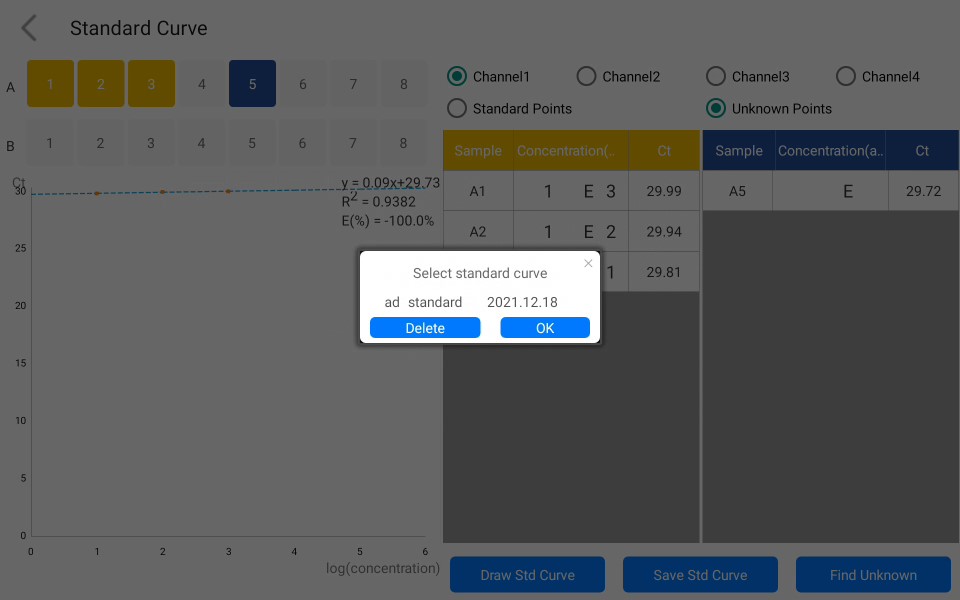
Figure 4-5-5 Selecting the standard curve used for the calculation
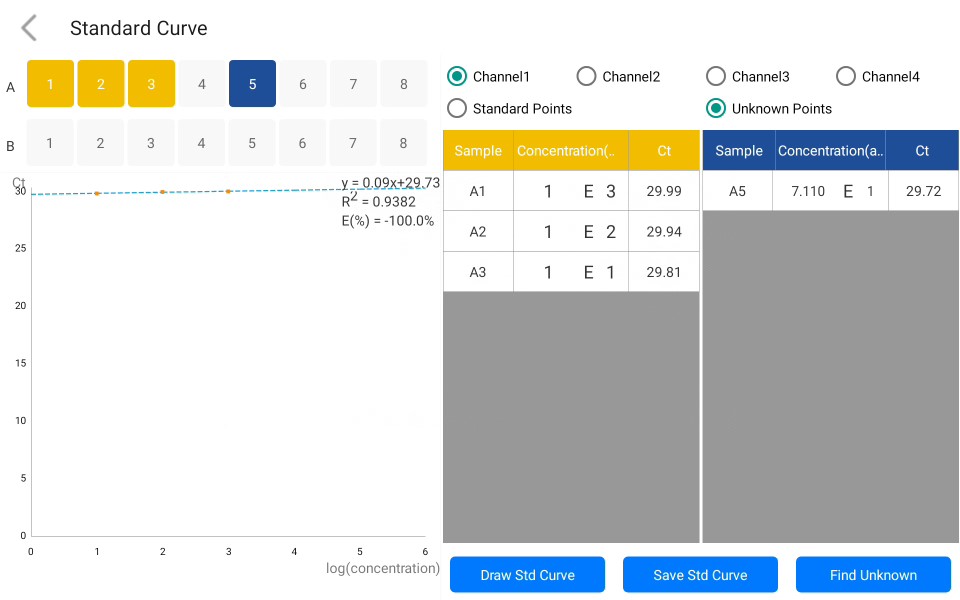
Figure 4-5-5 Calculating unknown points
4.6 Data export
1) Click the "Report" button in the experiment analysis interface to enter the PDF preview interface of the experiment report.
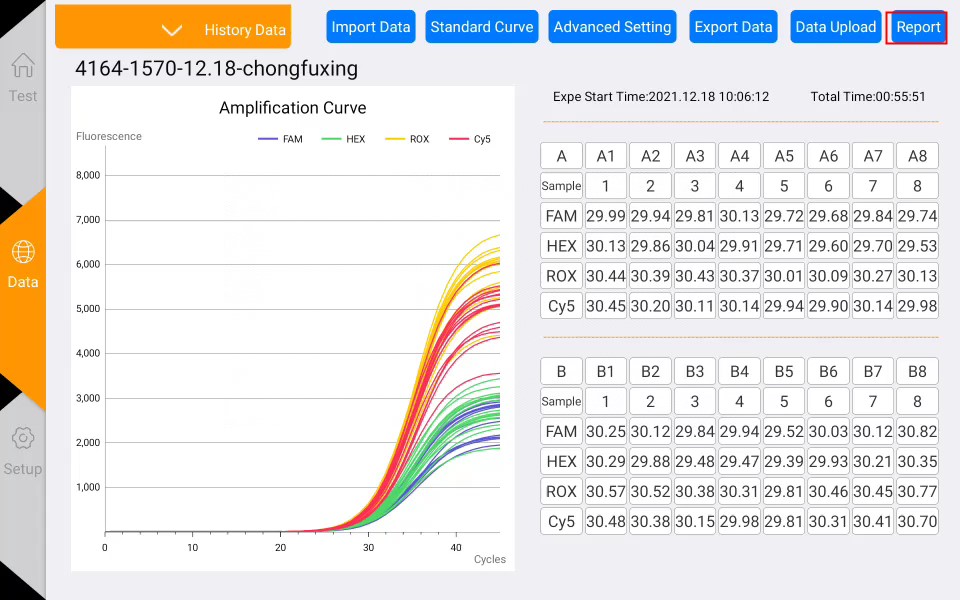
Figure 4-6-1 Data export
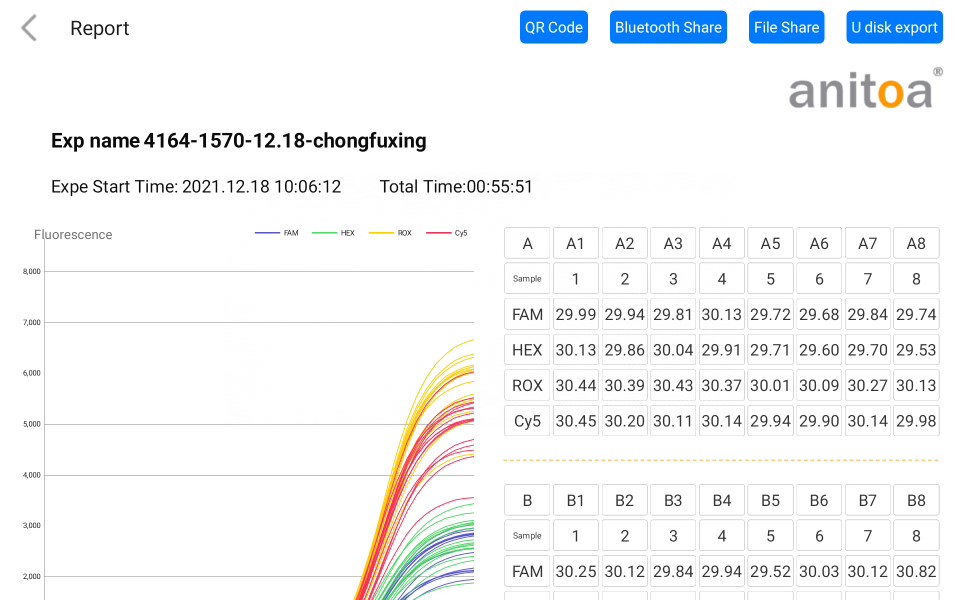
Figure 4-6-2 PDF preview page
2) At present, four sharing options are supported, which are "QR code", "Bluetooth share", "File share" and "U disk export". After inserting the USB flash drive, click the USB export, which means it is saved successfully, as shown in Figure 4-6-3.
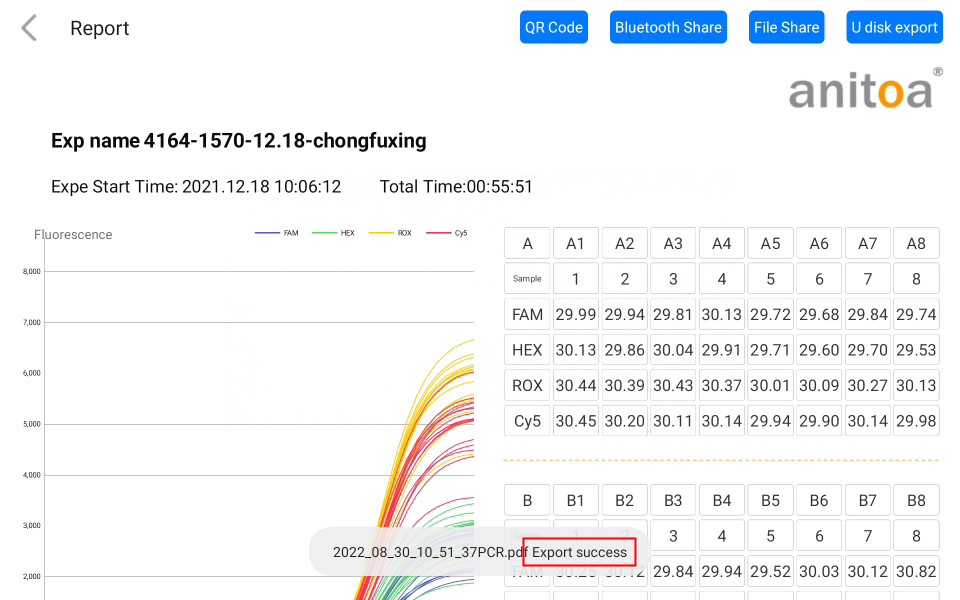
Figure 4-6-3 Export success page
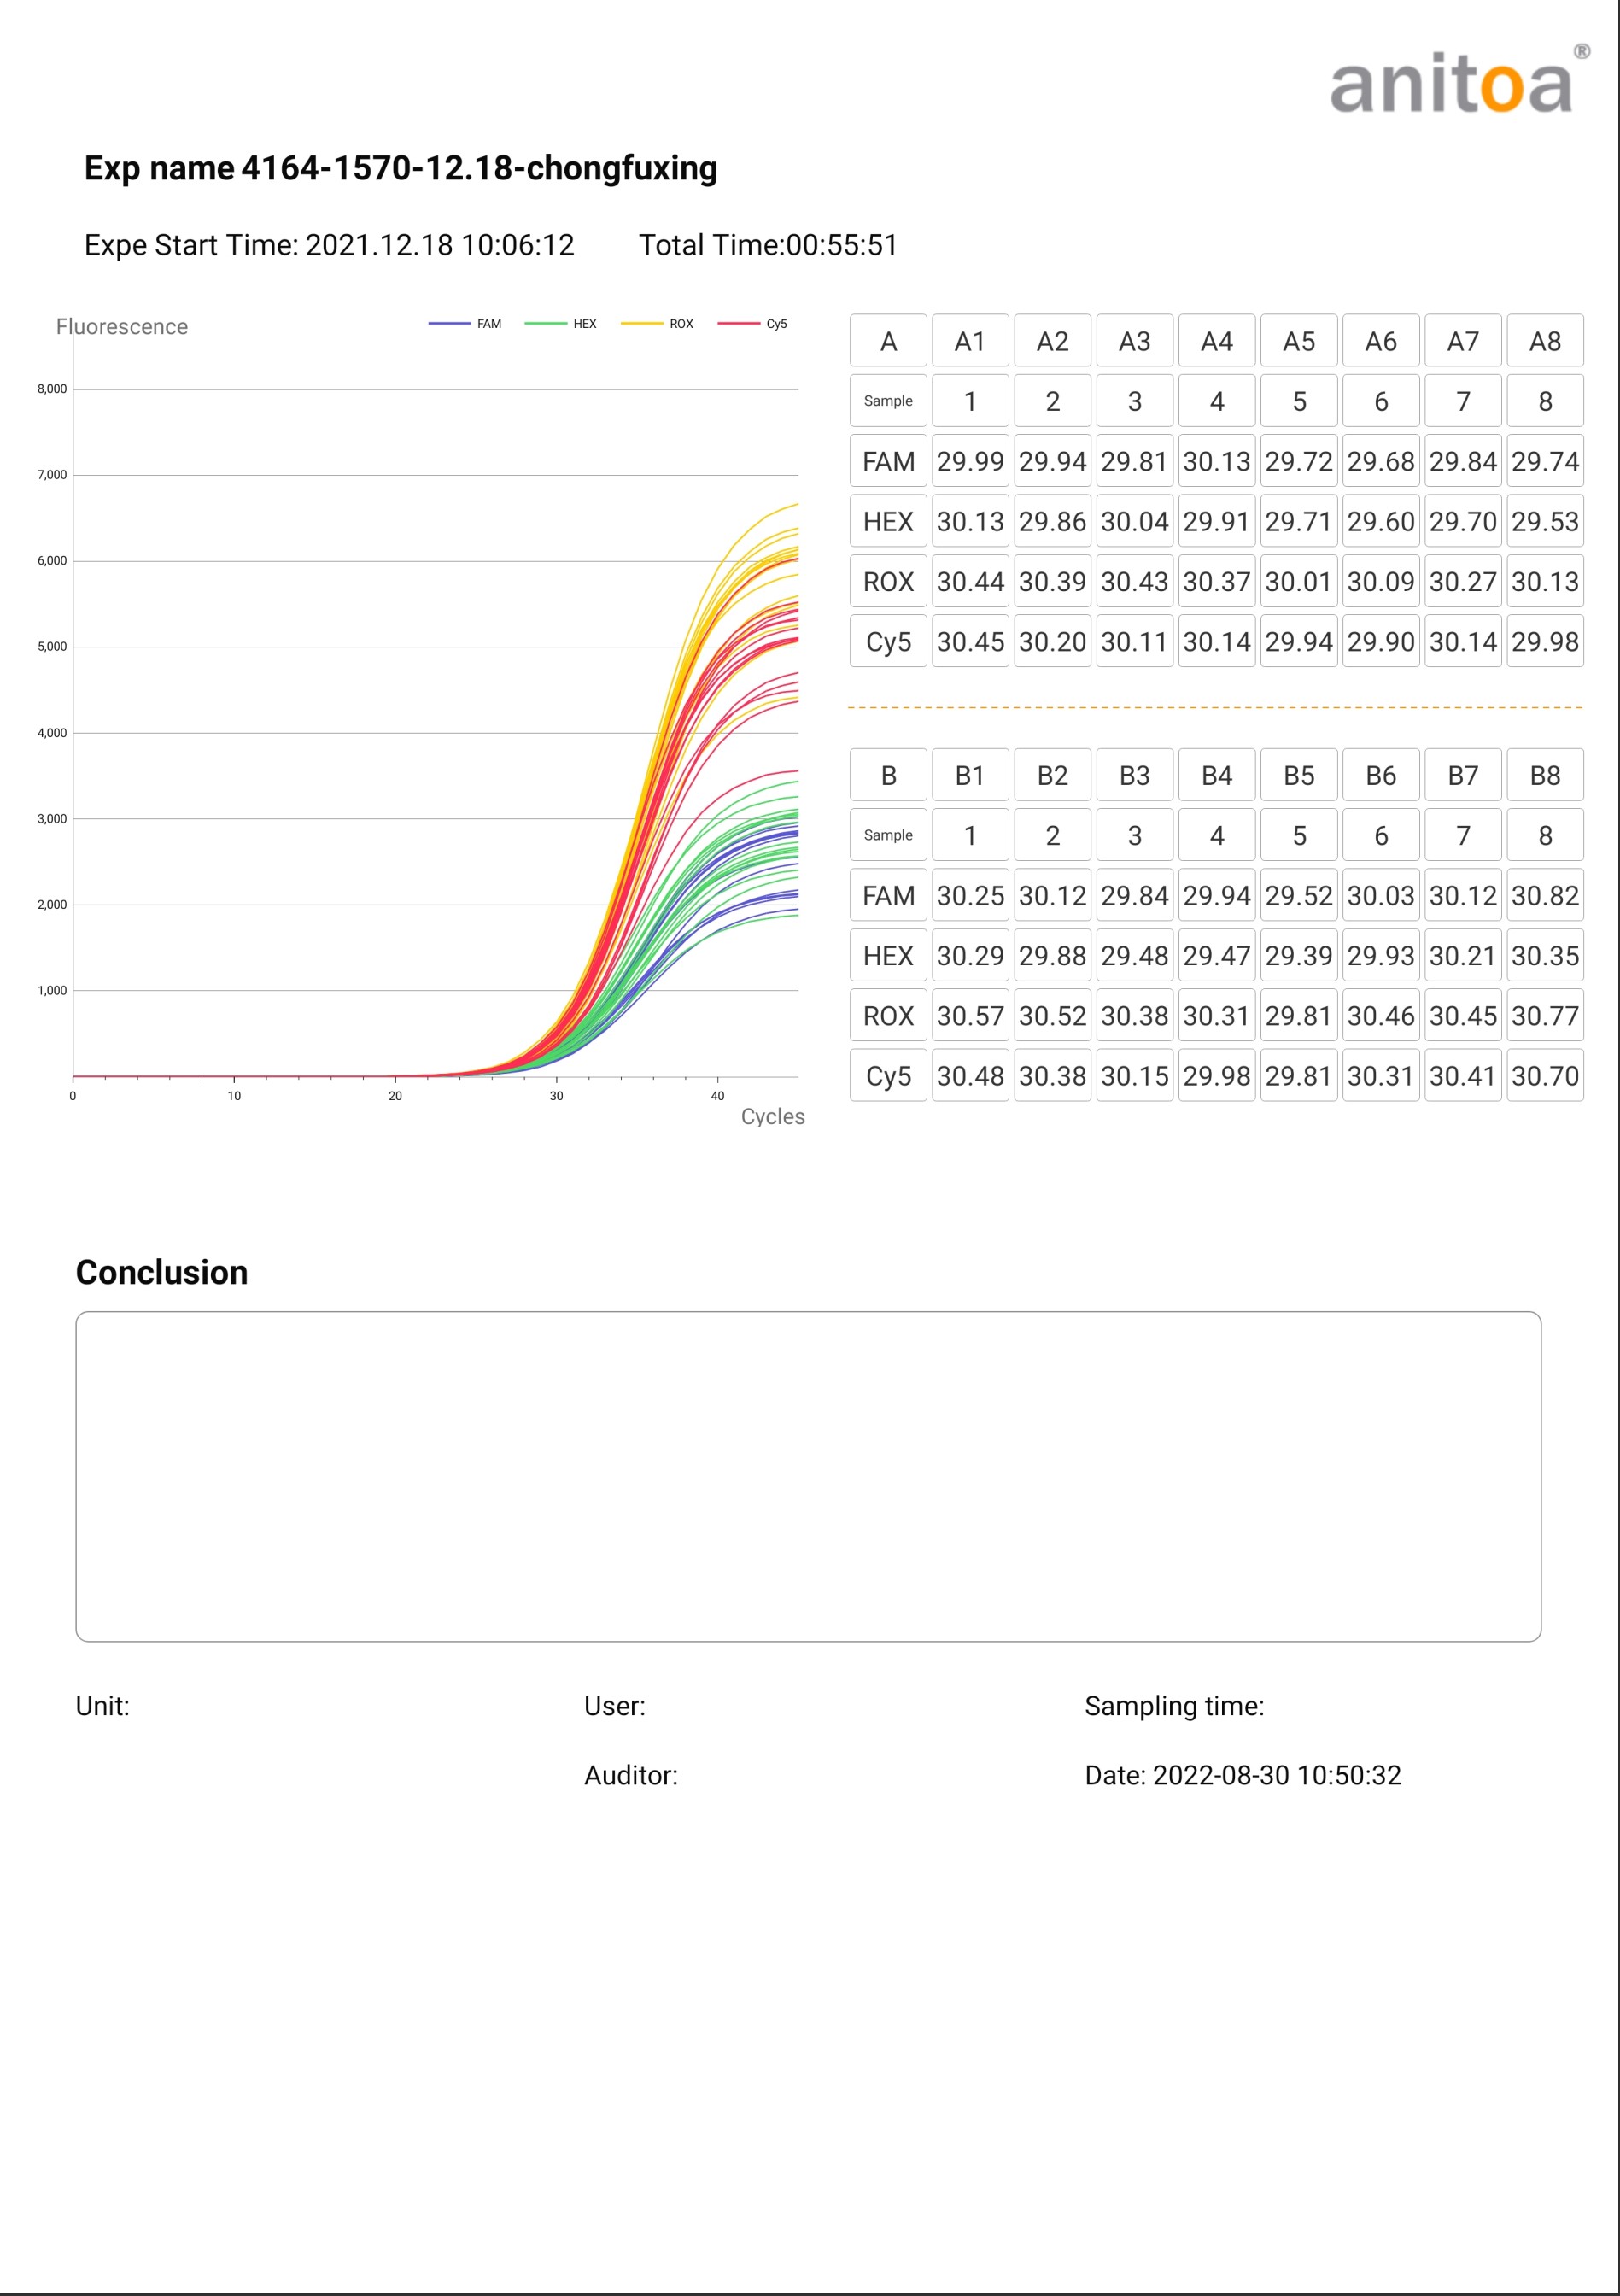
Figure 4-6-4 Preview of the complete PDF export interface
Professional Portable qPCR System Manufacturer - Anitoa
Anitoa is a professional R&D and manufacturing company of molecular diagnostic qPCR instruments and reagents, with independent intellectual property rights of core chip technology, optical technology, rapid heating, microfluidic control and supporting reagents and other patented technologies, so that the instruments developed by Anitoa are characterized by quick and easy small instruments, allowing the development of expensive and complex large PCR instruments into truly portable POCT products.