Molecular Diagnostic Knowledge - qPCR Terminology (Part 2)
Prev Article: Molecular Diagnostic Knowledge - qPCR Terminology (Part 1)
6. Amplicon
Short fragments of DNA generated by amplification during PCR.
7. Amplification Plot
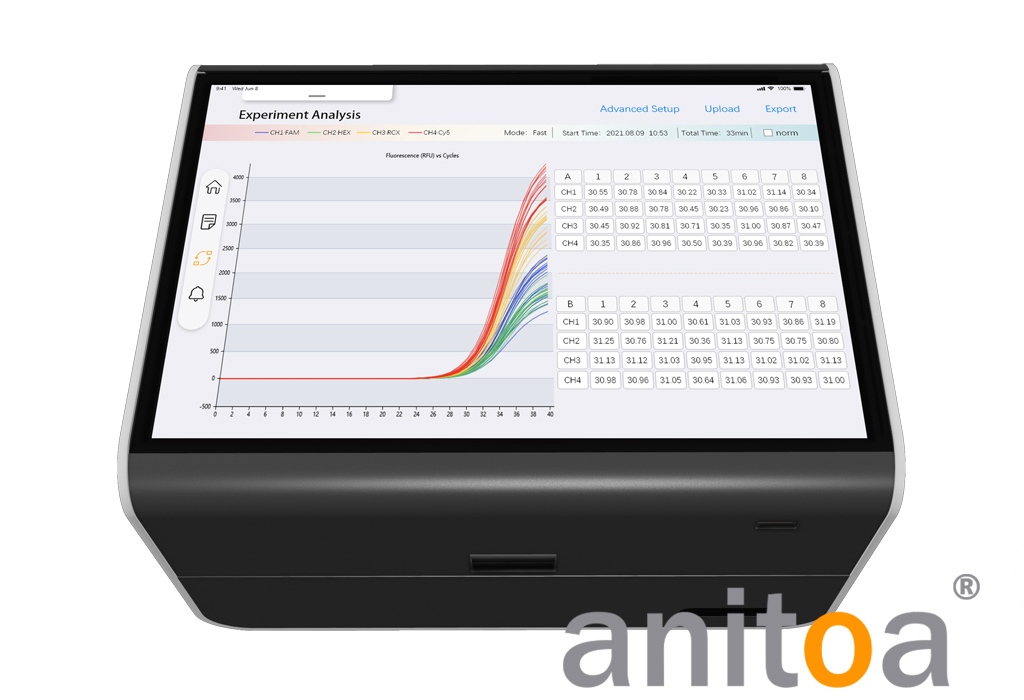
The PCR process is a curve made with the number of cycles as the horizontal coordinate and the real-time fluorescence signal during the reaction as the vertical coordinate. The amplification plot is generally divided into baseline phase, exponential growth phase and plateau phase.
The figure below shows an example of an experimental amplification plot for the Anitoa MQ4 qPCR instrument.

8. Baseline
The few cycles where the fluorescence signal has not yet changed at the start of PCR.
9. Background Signal
That is, the fluorescence background value of the sample, the amplified fluorescence signal is masked by the fluorescence background signal. The fluorescence signal of the first 15 cycles of the PCR reaction is generally used as the fluorescence background signal, which can be removed by the algorithm.
10. Fluorescence Threshold
The fluorescence threshold is set at the exponential phase of PCR amplification, and the default setting is 10 times the standard deviation of the fluorescence signal for 3-15 cycles, which is usually set automatically by the instrument. If set manually, the principle should be higher than the fluorescence background value of the sample, and also try to select the initial stage of entering the exponential phase.
11.Cycle Threshold, Ct value
The Ct value is the number of amplification cycles when the fluorescence signal of the amplification product reaches a set threshold value during fluorescent PCR amplification, and the Ct value is linearly related to the copy number of the template, the higher the starting copy number, the lower the number of cycles, and the smaller the Ct value.
12. Passive Reference Dye(ROX)
Used as an internal reference for fluorescence signal normalization, it can correct for variations caused by inaccurate pipetting, well position and fluorescence fluctuations on a well-by-well basis. Usually, different instruments have different ROX requirements. Currently, our Anitoa instruments do not require ROX calibration.
13.Melting Curve
After the completion of qPCR amplification, the PCR products are heated and the DNA is gradually unstranded as the temperature increases, leading to a decrease in fluorescence intensity, and when a certain temperature (Tm) is reached, this leads to a large amount of product unstranding and a sharp decrease in fluorescence. Melting curve analysis can be used to identify the different reaction products and to characterize the specificity of the PCR.
Professional Portable qPCR System Manufacturer - Anitoa
Anitoa is a professional R&D and manufacturing company of molecular diagnostic qPCR instruments and reagents, with independent intellectual property rights of core chip technology, optical technology, rapid heating, microfluidic control and supporting reagents and other patented technologies, so that the instruments developed by Anitoa are characterized by quick and easy small instruments, allowing the development of expensive and complex large PCR instruments into truly portable POCT products.